Create a dashboard for your smart meter
If your have a smart meter with support for DSMR (Dutch Smart Meter Requirements) then you can retrieve the serial data, via a USB to serial connector, or through a serial to network gateway, by connecting to the “P1 port” on the meter.
I will be using a P1 wifi gateway, in my case both gas and electricity data are accessible via the same meter. For water I use the Watermeter Gateway.
For installing and configuring of both gateways follow the instruction that came with the devices.
Requirements
- Smart metering system
- P1 wifi gateway
- Watermeter Gateway
- Raspberry Pi 4+
- 64 bit Raspberry Pi OS
- Grafana
- Influxdb
- Telegraf
- Mosquitto
Overview
P1 wifi gateway via MQTT --> Mosquitto <-- Telegraph
                                               |
                                               V
                                            Influxdb
                                               ^
                                               |
                                            Grafana
The P1 wifi gateway (and the Watermeter gateway) will send the gathered data with the MQTT protocol, approx. every 5-10 seconds, to the Mosquitto MQTT broker. From the MQTT broker Telegraf will read the topics and output them to an InfluxDB bucket. Grafana then uses the InfluxDB as a data source and displays your graphs.
Installation
Preparing you Raspberry Pi
Download the 64 bit Raspberry Pi OS Lite manually and image your sd-card with Raspberry Pi Imager or BalenaEtcher.
Update: The Raspberry Pi Imager now has the 64-bit images under
Raspberry Pi OS (other).
Add the Grafana repository
$ wget -q -O - https://packages.grafana.com/gpg.key | sudo apt-key add -
$ echo "deb https://packages.grafana.com/oss/deb stable main" | sudo tee -a /etc/apt/sources.list.d/grafana.list
Install Grafana and Mosquitto
$ sudo apt-get update
$ sudo apt-get install grafana mosquitto
Enable and setup Mosquitto
$ sudo /bin/systemctl enable mosquitto
$ sudo /bin/systemctl start mosquitto

$ sudo touch /etc/mosquitto/passwd
$ sudo mosquitto_passwd -b /etc/mosquitto/passwd mosquitto mosquitto
Add the mosquitto.conf and restart.
$ cat /etc/mosquitto/conf.d/mosquitto.conf
listener 1883
log_type error
log_type warning
log_type notice
log_type information
connection_messages true
log_timestamp true
allow_anonymous false
password_file /etc/mosquitto/passwd

$ sudo systemctl restart mosquitto
Install and start InfluxDB
$ wget -qO- https://repos.influxdata.com/influxdb2.key | sudo apt-key add -
$ wget https://dl.influxdata.com/influxdb/releases/influxdb2-2.0.9-arm64.deb
$ sudo dpkg -i influxdb2-2.0.9-arm64.deb

$ sudo /bin/systemctl enable influxd
$ sudo /bin/systemctl start influxd
You can now access the influxDB at: http://<ip address>:8086 with admin as user and password.
Add a bucket and generate an access token for Telegraf and Grafana.
Install and setup Telegraf
$ wget https://dl.influxdata.com/telegraf/releases/telegraf_1.20.2-1_arm64.deb
$ sudo dpkg -i telegraf_1.20.2-1_arm64.deb

$ sudo /bin/systemctl enable telegraf
$ sudo /bin/systemctl start telegraf
Move the default configuration aside.
$ sudo mv /etc/telegraf/telegraf.conf /etc/telegraf/telegraf.org
Create the telegraf.conf as below and add your influxdb token and bucket at the bottom of the file and then restart.
$ cat /etc/telegraf/telegraf.d/smart_meter.conf
[[inputs.mqtt_consumer]]
name_override = "electricity"
servers = ["tcp://localhost:1883"]
username = "mosquitto"
password = "mosquitto"
topics = [
  "dsmr/reading/electricity_delivered_1",
  "dsmr/reading/electricity_returned_1",
  "dsmr/reading/electricity_delivered_2",
  "dsmr/reading/electricity_returned_2",
  "dsmr/reading/electricity_currently_delivered",
  "dsmr/reading/electricity_currently_returned",
  "dsmr/reading/phase_currently_delivered_l1",
  "dsmr/reading/phase_currently_delivered_l2",
  "dsmr/reading/phase_currently_delivered_l3",
  "dsmr/reading/phase_currently_returned_l1",
  "dsmr/reading/phase_currently_returned_l2",
  "dsmr/reading/phase_currently_returned_l3",
  "dsmr/reading/phase_voltage_l1",
  "dsmr/reading/phase_voltage_l2",
  "dsmr/reading/phase_voltage_l3",
  "dsmr/reading/phase_power_current_l1",
  "dsmr/reading/phase_power_current_l2",
  "dsmr/reading/phase_power_current_l3",
  "dsmr/reading/electricity_hourly_usage"
]
data_format = "value"
data_type = "float"

[[inputs.mqtt_consumer]]
name_override = "dsrm"
servers = ["tcp://localhost:1883"]
username = "mosquitto"
password = "mosquitto"
topics = [
  "dsmr/reading/electricity_equipment_id",
  "dsmr/reading/electricity_tariff",
  "dsmr/reading/gas_equipment_id"
]
data_format = "value"
data_type = "string"

[[inputs.mqtt_consumer]]
name_override = "gas"
servers = ["tcp://localhost:1883"]
username = "mosquitto"
password = "mosquitto"
topics = [
  "dsmr/reading/gas_hourly_usage",
  "dsmr/consumption/gas/delivered"

]
data_format = "value"
data_type = "float"

[[inputs.mqtt_consumer]]
name_override = "water"
servers = ["tcp://localhost:1883"]
username = "mosquitto"
password = "mosquitto"
topics = [
  "watermeter/reading/current_value",
  "watermeter/reading/pulse_factor",
  "watermeter/reading/pulse_count"
]
data_format = "value"
data_type = "int"

[[outputs.influxdb_v2]]
urls = ["http://localhost:8086"]
token = "<your token here>"
organization = "<your org here>"
bucket = "<your bucket name here>"

$ sudo /bin/systemctl restart telegraf
Enable and start Grafana
$ sudo /bin/systemctl enable grafana-server
$ sudo /bin/systemctl start grafana-server
You can now access Grafana at: http://<ip address>:3000 with admin as user and password.
Add the InfluxDB as a new datasource and start creating your dashboard.
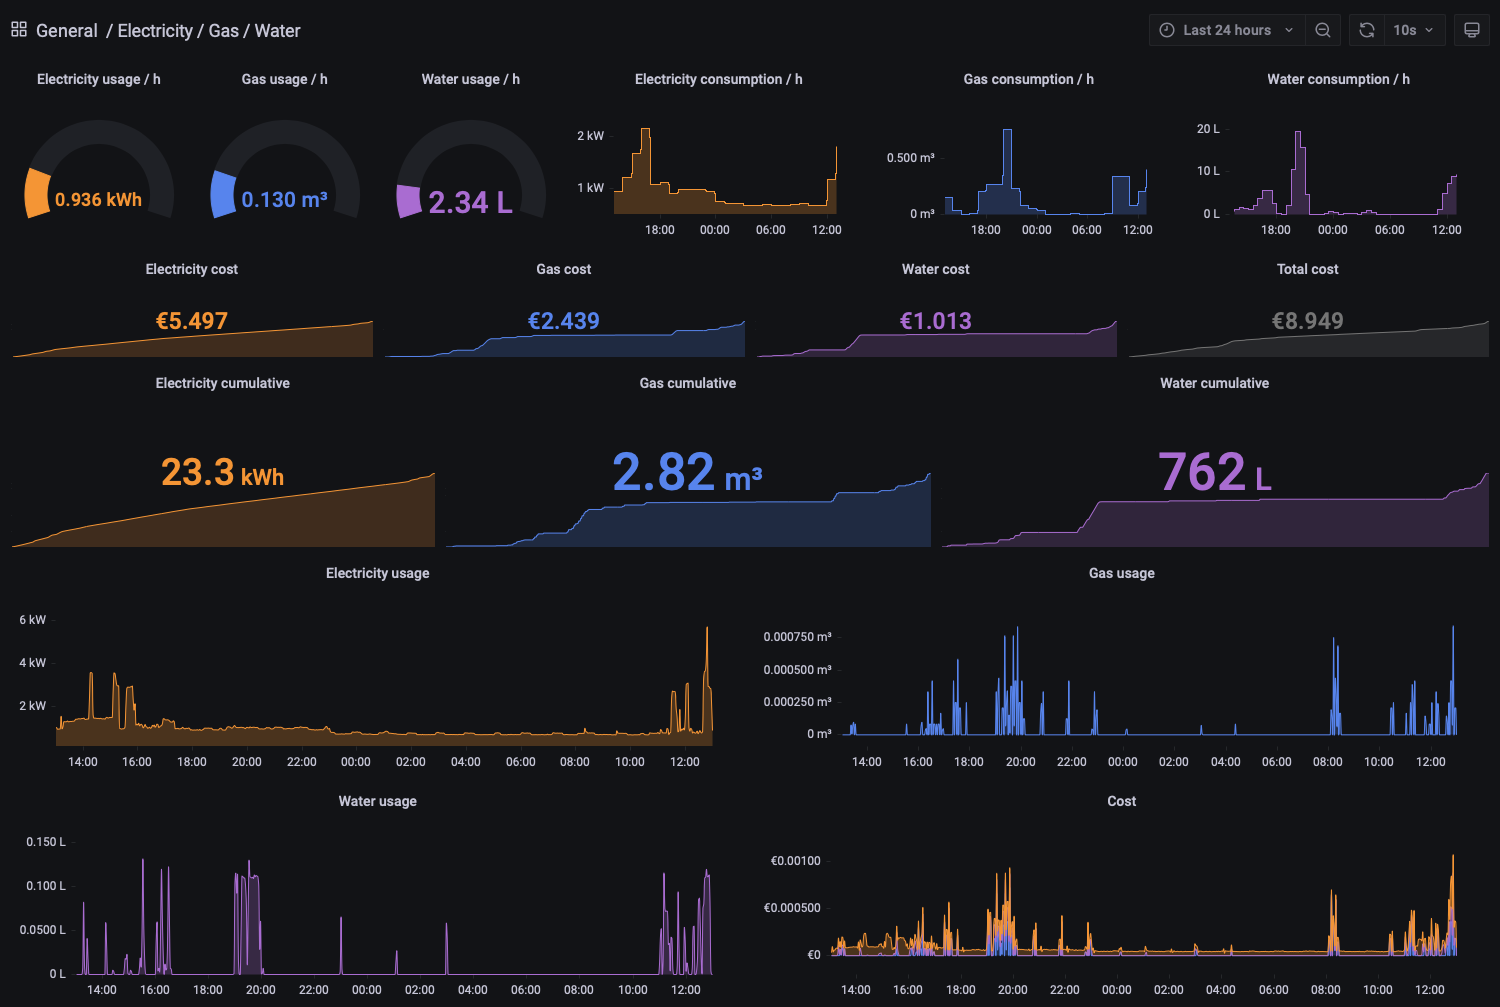
Example Grafana Dashboard
You can find an example dashboard here on my github page.
Instructions: Edit the
dashboard.jsonand replace the bucketname “smart_meter” with your bucket name, same goes for the organisation and token, and then import it.